Customer Acquisition Cost Calculation for Startups
Most founders forget to count their sales team's time in CAC, cutting the real number in half.

CAC = (Total sales costs + Total marketing costs) ÷ Number of new customers acquired in the same period
That "same period" part is not optional. Costs and customers have to belong to the same window. Period mismatch is one of the most common errors in startup finance, and we'll get to it later.
Here's what goes in the numerator:
- Paid advertising (Google, Meta, LinkedIn, wherever you're spending)
- Sales team salaries and commissions, allocated proportionally
- Marketing tools, CRM software, and SaaS subscriptions that support acquisition
- Content creation and creative production tied to acquisition campaigns
- Agency fees for acquisition work
That second bullet is the one most teams get wrong. If someone on your team earns $90,000 and spends 40% of their time acquiring new customers, $36,000 goes into the CAC numerator. Not the full salary. And zero is equally wrong. The proportional slice is what matters, and most founders skip it entirely, then wonder why their unit economics look better on paper than they feel in the bank, a gap that shows up clearly once contribution margin is stress-tested against real costs.
Here's what stays out: retention, customer success, and upsell costs belong somewhere else. So does product development. And free trial users don't count. Only new paying customers go in the denominator.
There are three versions of CAC worth knowing. New CAC isolates spend on net-new customers only. It's harder to calculate, usually higher, and the most honest version of the number. Blended CAC divides total sales and marketing spend by all customers, including existing ones. Useful for board decks, less useful for actually running your acquisition strategy. Fully loaded CAC adds overhead allocation on top of direct spend, which gives you the most accurate picture of true unit economics but takes more work to build.
One thing worth flagging before moving on: blended CAC has risen 10% since 2022, per Benchmarkit's 2025 data. The baseline is already moving. If your targets haven't adjusted, they're probably stale.
A Worked Example That Shows How the Line Items Add Up
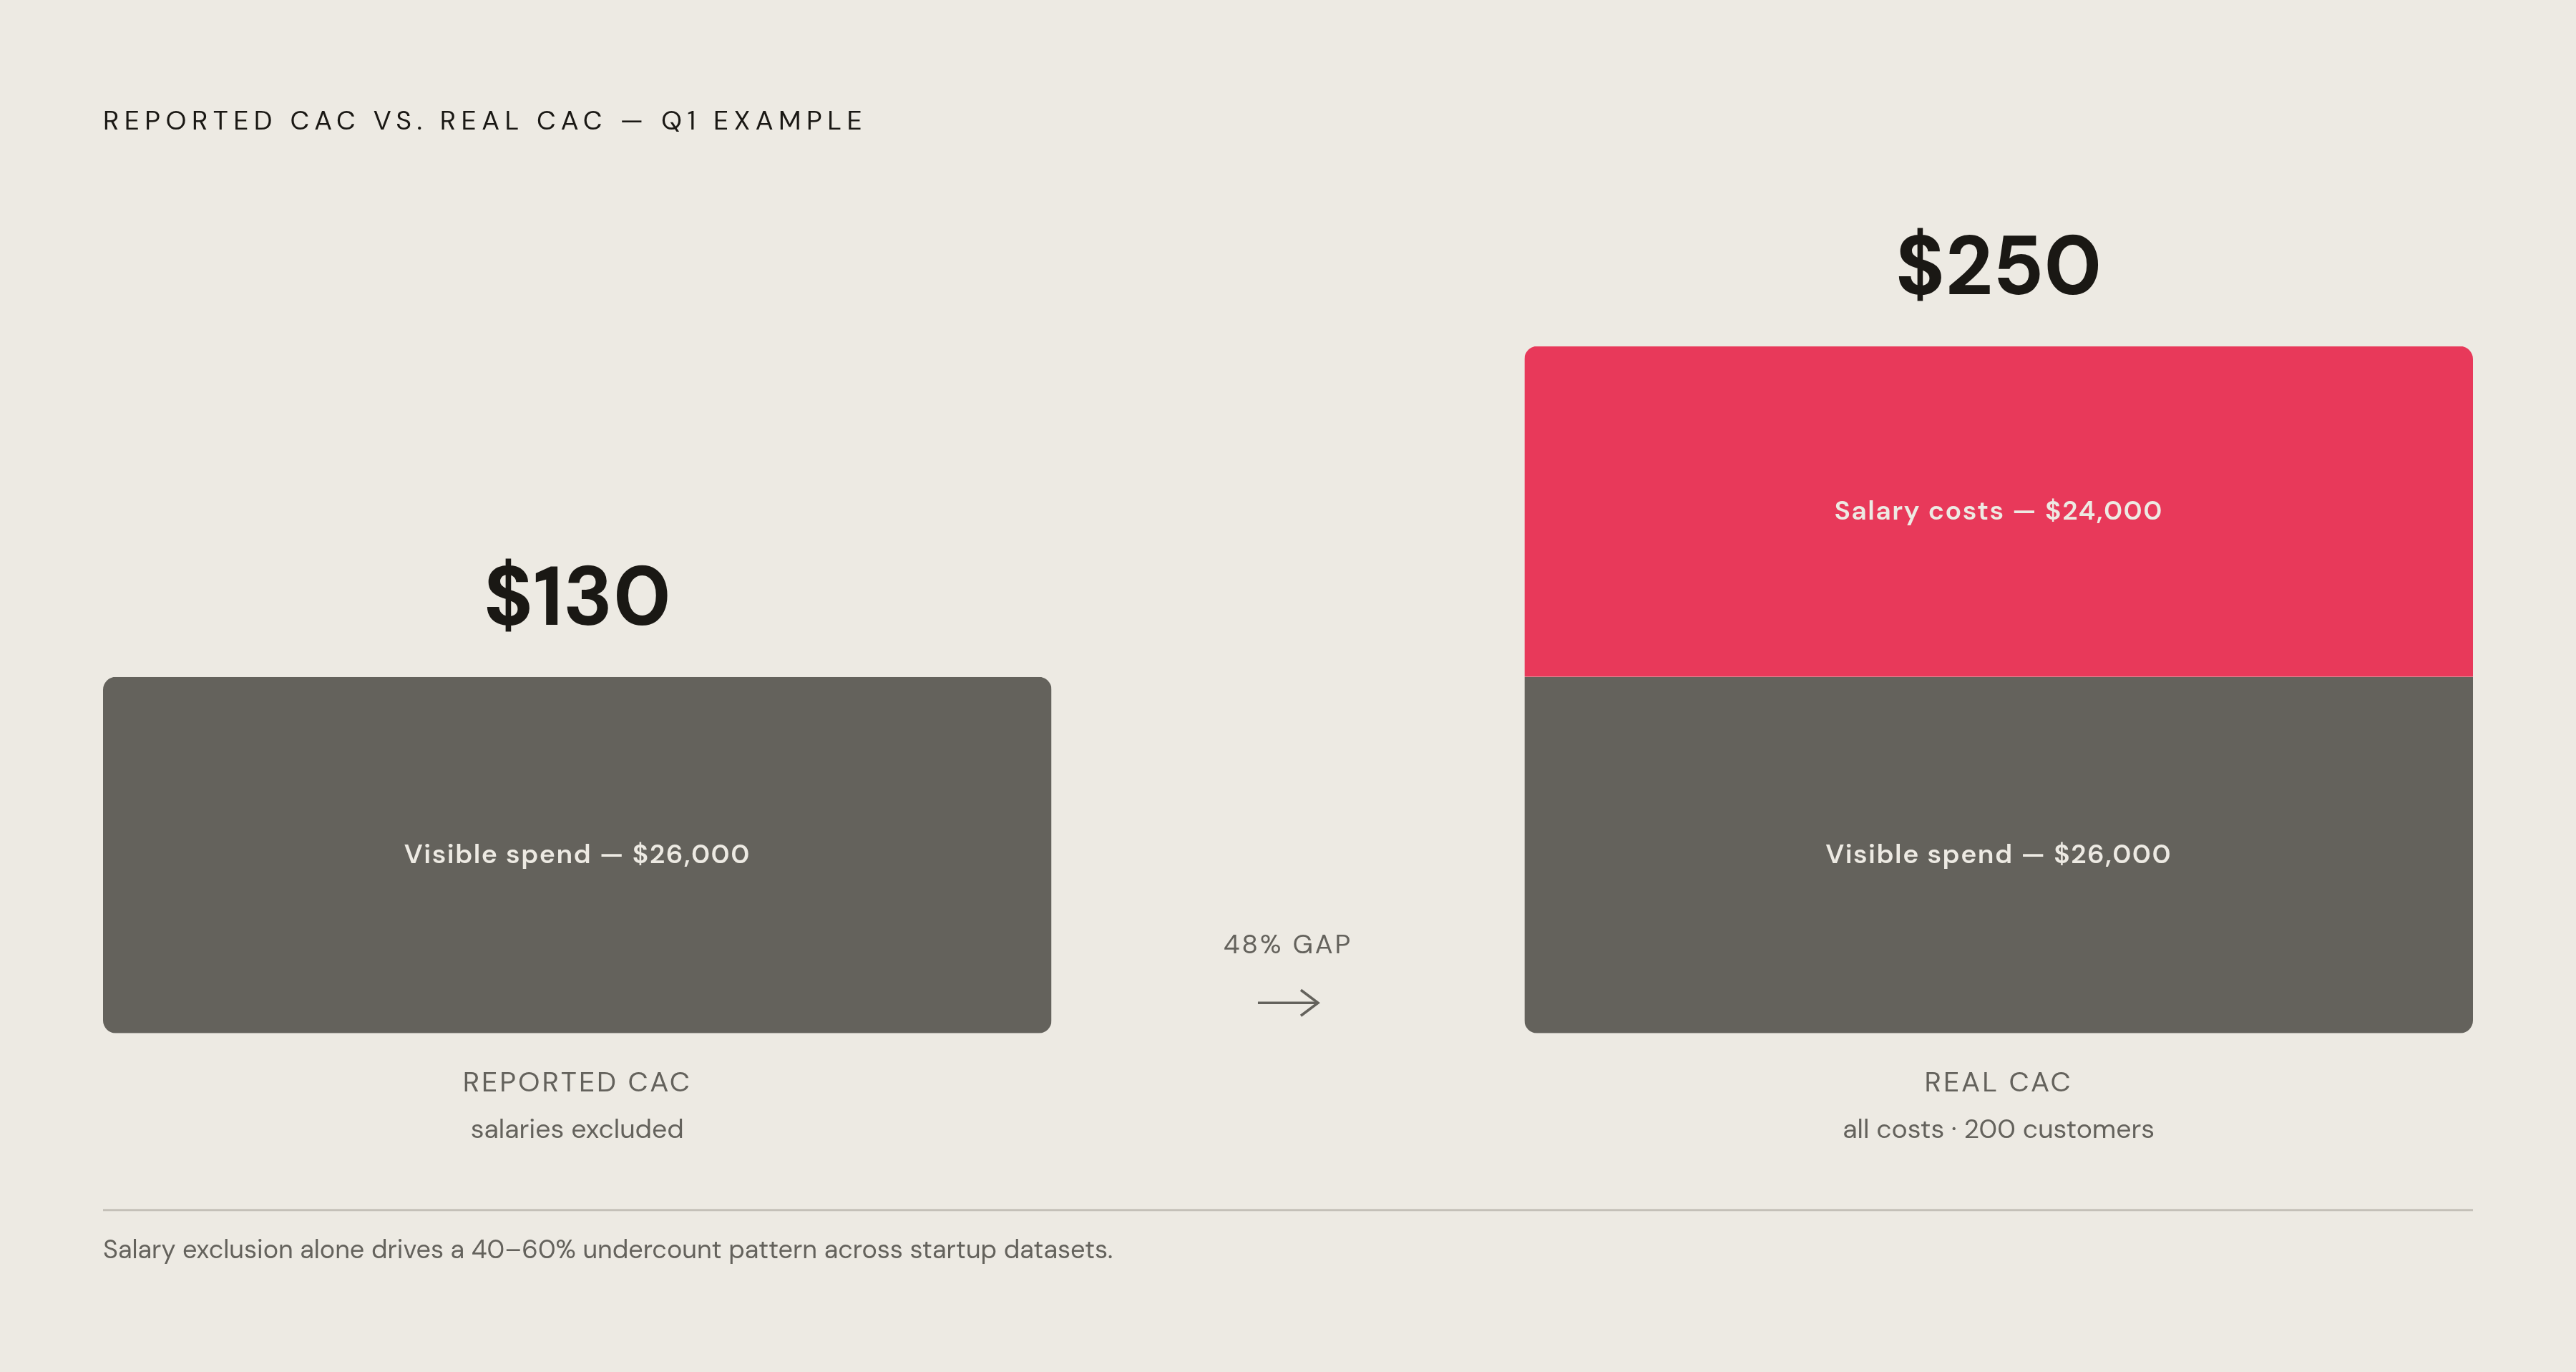
Here's a fictional SaaS startup, Q1. No tricks.
- Paid advertising: $18,000
- Sales team salaries and commissions: $24,000
- Marketing tools and CRM: $3,200
- Content creation: $4,800
- Total: $50,000
- New customers acquired: 200
- CAC: $250
Clean. Now look at the salary piece. Say this startup has a sales director earning $120,000 a year, and she spends 60% of her time on new customer acquisition. That's $72,000 a year flowing into the numerator. Not her whole salary. Not a rounding error.
Here's what happens when founders skip that step. Strip out the salary costs from that $50,000 and you're down to roughly $26,000 in visible spend. That produces a CAC of $130. Less than half the real number. That's not a margin of error — that's like navigating by a map that's missing half the roads. It describes a fundamentally different business, with a fundamentally different story about whether it survives at scale.
This is the 40 to 60 percent undercount pattern that shows up across startup datasets. It's a people problem, not a math problem. People count what's easy to count and ignore what requires an honest look at their own calendar. And the irony is that the invisible costs, the ones with no invoice attached, are usually the biggest ones.
On period alignment: if your startup spent heavily in Q4 on a campaign that closed customers in Q1, you cannot attribute Q4 spend to Q1 customers. That distorts both periods. If your sales cycle is long, build a consistent lag model. Don't force numbers into the wrong quarter because the calendar flipped.
Why a Single Blended CAC Misleads, and How to Break It Down By Channel
A single company-wide CAC is better than nothing. It also hides everything interesting.
Paid search, organic, outbound, referral, and events all have completely different cost structures and conversion rates. Averaging them together produces a number that's technically accurate and operationally useless at the same time. You can't make good allocation decisions from it. You're essentially averaging your fastest and slowest salespeople and using that figure to set the hiring bar.
Channel-level CAC uses the same formula, just applied within each acquisition channel separately. Spend on that channel, divided by the customers that channel brought in.
Back to the Q1 example: Google Ads drove 80 of those 200 customers and consumed the full $18,000 ad budget, plus a proportional slice of the content budget. Its channel CAC is going to be higher than the blended $250. You can't know without doing the math.
Organic and referral channels are trickier because they often look free. They aren't. Your content team's time has a cost. Referral incentives have a cost. Those need to get allocated into each channel's cost basis, not ignored because there's no invoice attached.
The strategic payoff is real. Channel-level CAC lets you reallocate budget toward what's actually working. It also protects you from a specific trap: a channel that looks cheap at low volume often gets substantially more expensive as you scale it. Google Ads costs rose roughly 40% year over year in 2024. A channel that made sense at your current spend will not survive a 3x budget increase. You won't catch that in a blended number.
One benchmark worth knowing: the median New CAC Ratio reached $2.00 per $1 of new ARR in 2024, up 14% year over year. Companies in the bottom quartile were at $2.82. Channel segmentation is largely how top-performing companies stay out of that group.
One hard prerequisite: your CRM tagging, UTM discipline, and attribution model have to be solid. Channel CAC is only as good as the attribution data feeding it. Sloppy tracking produces segmentation that looks real and isn't.
What CAC Benchmarks Actually Look Like Across Industries in 2025
The average startup CAC in 2025 is around $225. That number is also nearly meaningless without context.
Here's what the ranges actually look like by sector:
- E-commerce: $10 to $50 for most purchase decisions; can reach $2,190 at the enterprise level
- B2C SaaS / consumer: typically under $300
- B2B SaaS: broadly $200 to $700 and up, averaging around $656 to $702 depending on the dataset, driven by longer sales cycles and more stakeholders in the buying decision
- Fintech (broad market): around $1,450; fintech targeting enterprise customers: $14,772. Regulatory complexity and trust-building requirements account for most of that gap.
- Insurance: around $1,280
- Arts and entertainment: around $21, often riding word-of-mouth dynamics
The upmarket multiplier is real. Within the same vertical, CAC can rise more than 10x moving from SMB to enterprise. The segment you're selling into matters as much as the industry you're in.
There's a structural difference between B2B and B2C that explains a lot of this. B2B deals involve multiple decision-makers, procurement layers, and timelines that drag. Subscription models can absorb higher upfront acquisition costs because revenue recurs over time, making payback period a more forgiving constraint than it is in transactional models. One-time purchase models can't. You have to earn it back on the first transaction because there isn't a second one built into the model.
Sales cycles also lengthened significantly in 2024 as buying committees expanded. Benchmarks from two or three years ago are too optimistic for current planning.
Use these as diagnostics, not targets. A CAC below your industry average isn't automatically good news. If your LTV is also low, the ratio still doesn't work.
How to Pair CAC With LTV to Know Whether Acquisition Spend Is Actually Working
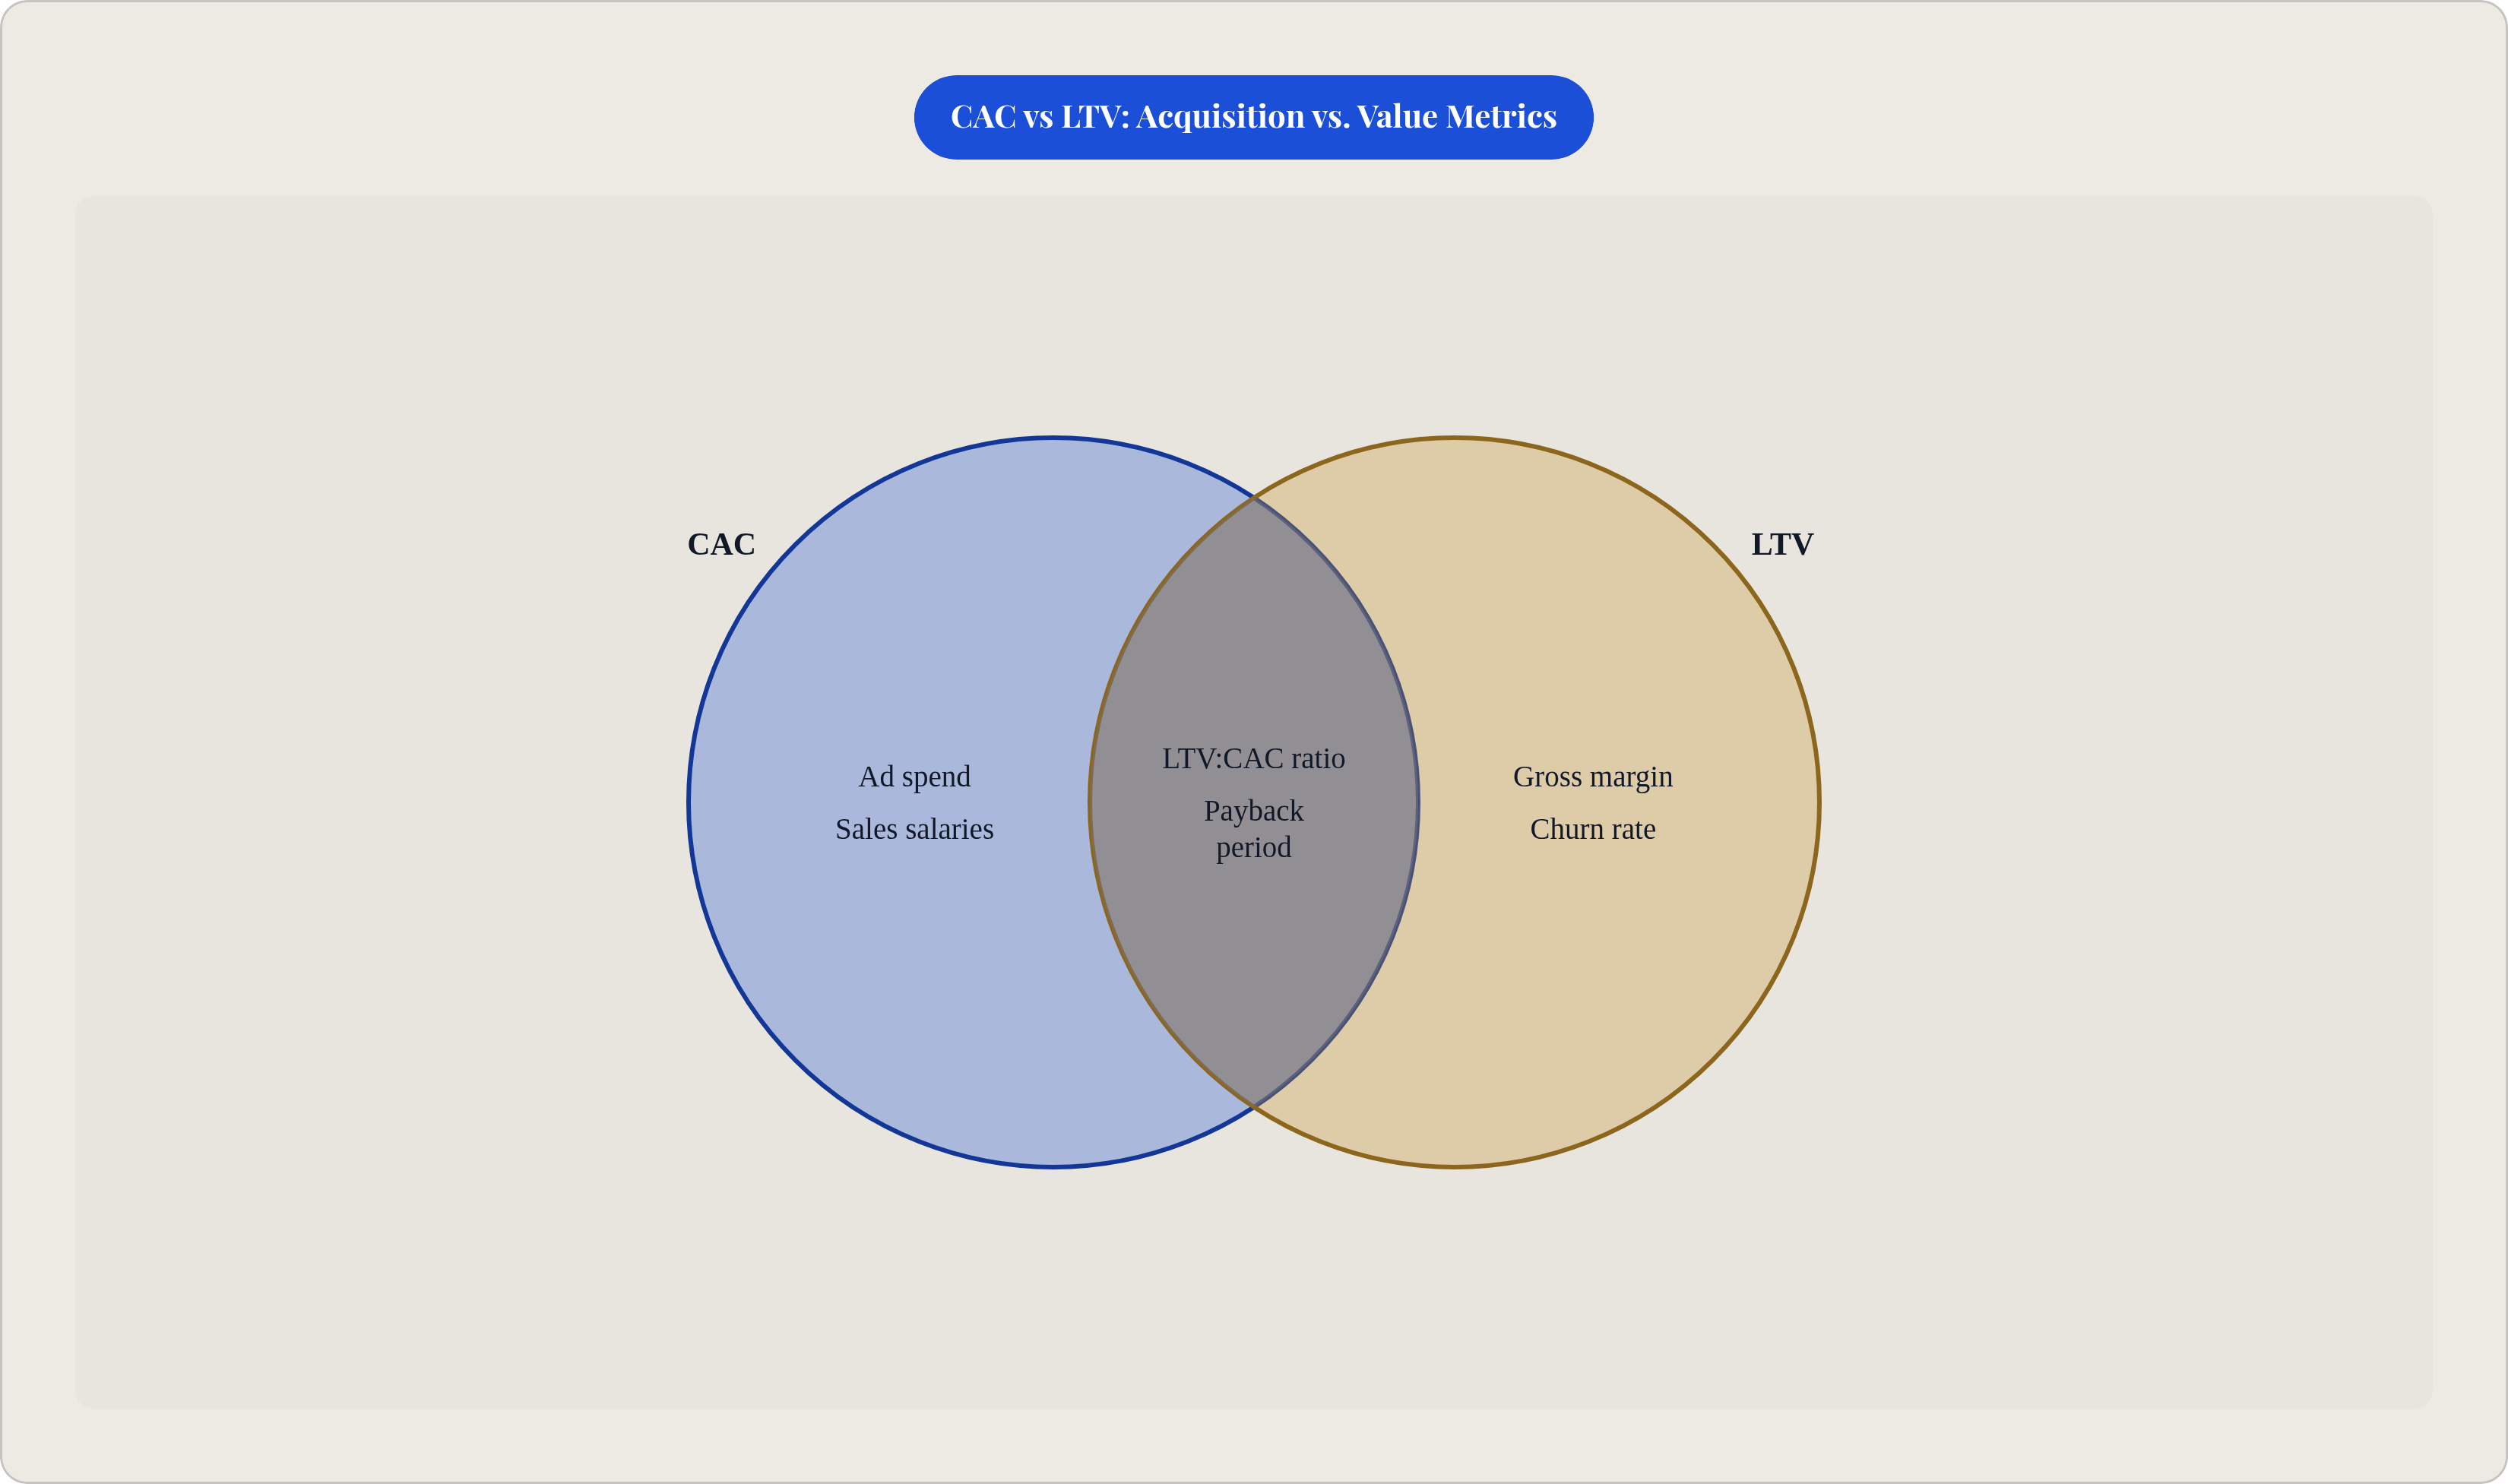
CAC alone answers "what did we spend?" LTV:CAC answers "was it worth it?"
LTV for a SaaS business:
LTV = (Average Revenue per Account × Gross Margin) ÷ Churn Rate
Quick example. A customer paying $100 per month with an 80% gross margin and a 24-month average lifespan has an LTV of $1,920. The key word in that formula is gross margin, not revenue, because gross margin strips out the cost of goods sold and gives you the actual economics of delivering the product. Using revenue instead inflates LTV by 20 to 40%, and that error flows directly into your LTV:CAC ratio and makes the business look more efficient than it is. Investors who have seen this pattern before will find it.
The widely cited target is 3:1 to 5:1. You're generating three to five times more value from a customer than you spent to acquire them. Below 3:1, acquisition is unprofitable at scale. Consistently above 6:1, you are underinvesting in growth and leaving reachable customers behind. The median B2B SaaS LTV:CAC sits at 3.2:1, per the Optifai Sales Ops Benchmark, which surveyed 939 companies between Q2 2025 and Q1 2026.
Early-stage startups running at 1.5x to 2x aren't necessarily in trouble. They're often still building toward efficiency, and early figures can be noisy. The ratio becomes a more reliable signal around $5M to $10M ARR, when you have enough cohort data from cohort analysis to trust the churn rate underneath it. Enterprise SaaS with high ARR and long contracts often targets 5x or higher. Consumer SaaS with higher churn settles in the 2x to 4x range.
One thing that corrupts this ratio quietly: if you've been calculating CAC using only ad spend, you are understating it by 2x or more. That inflates LTV:CAC in a way that looks great until it meets a real cash flow problem. The ratio is only as honest as the CAC underneath it.
Using CAC Payback Period to Translate Unit Economics Into a Cash Flow Timeline
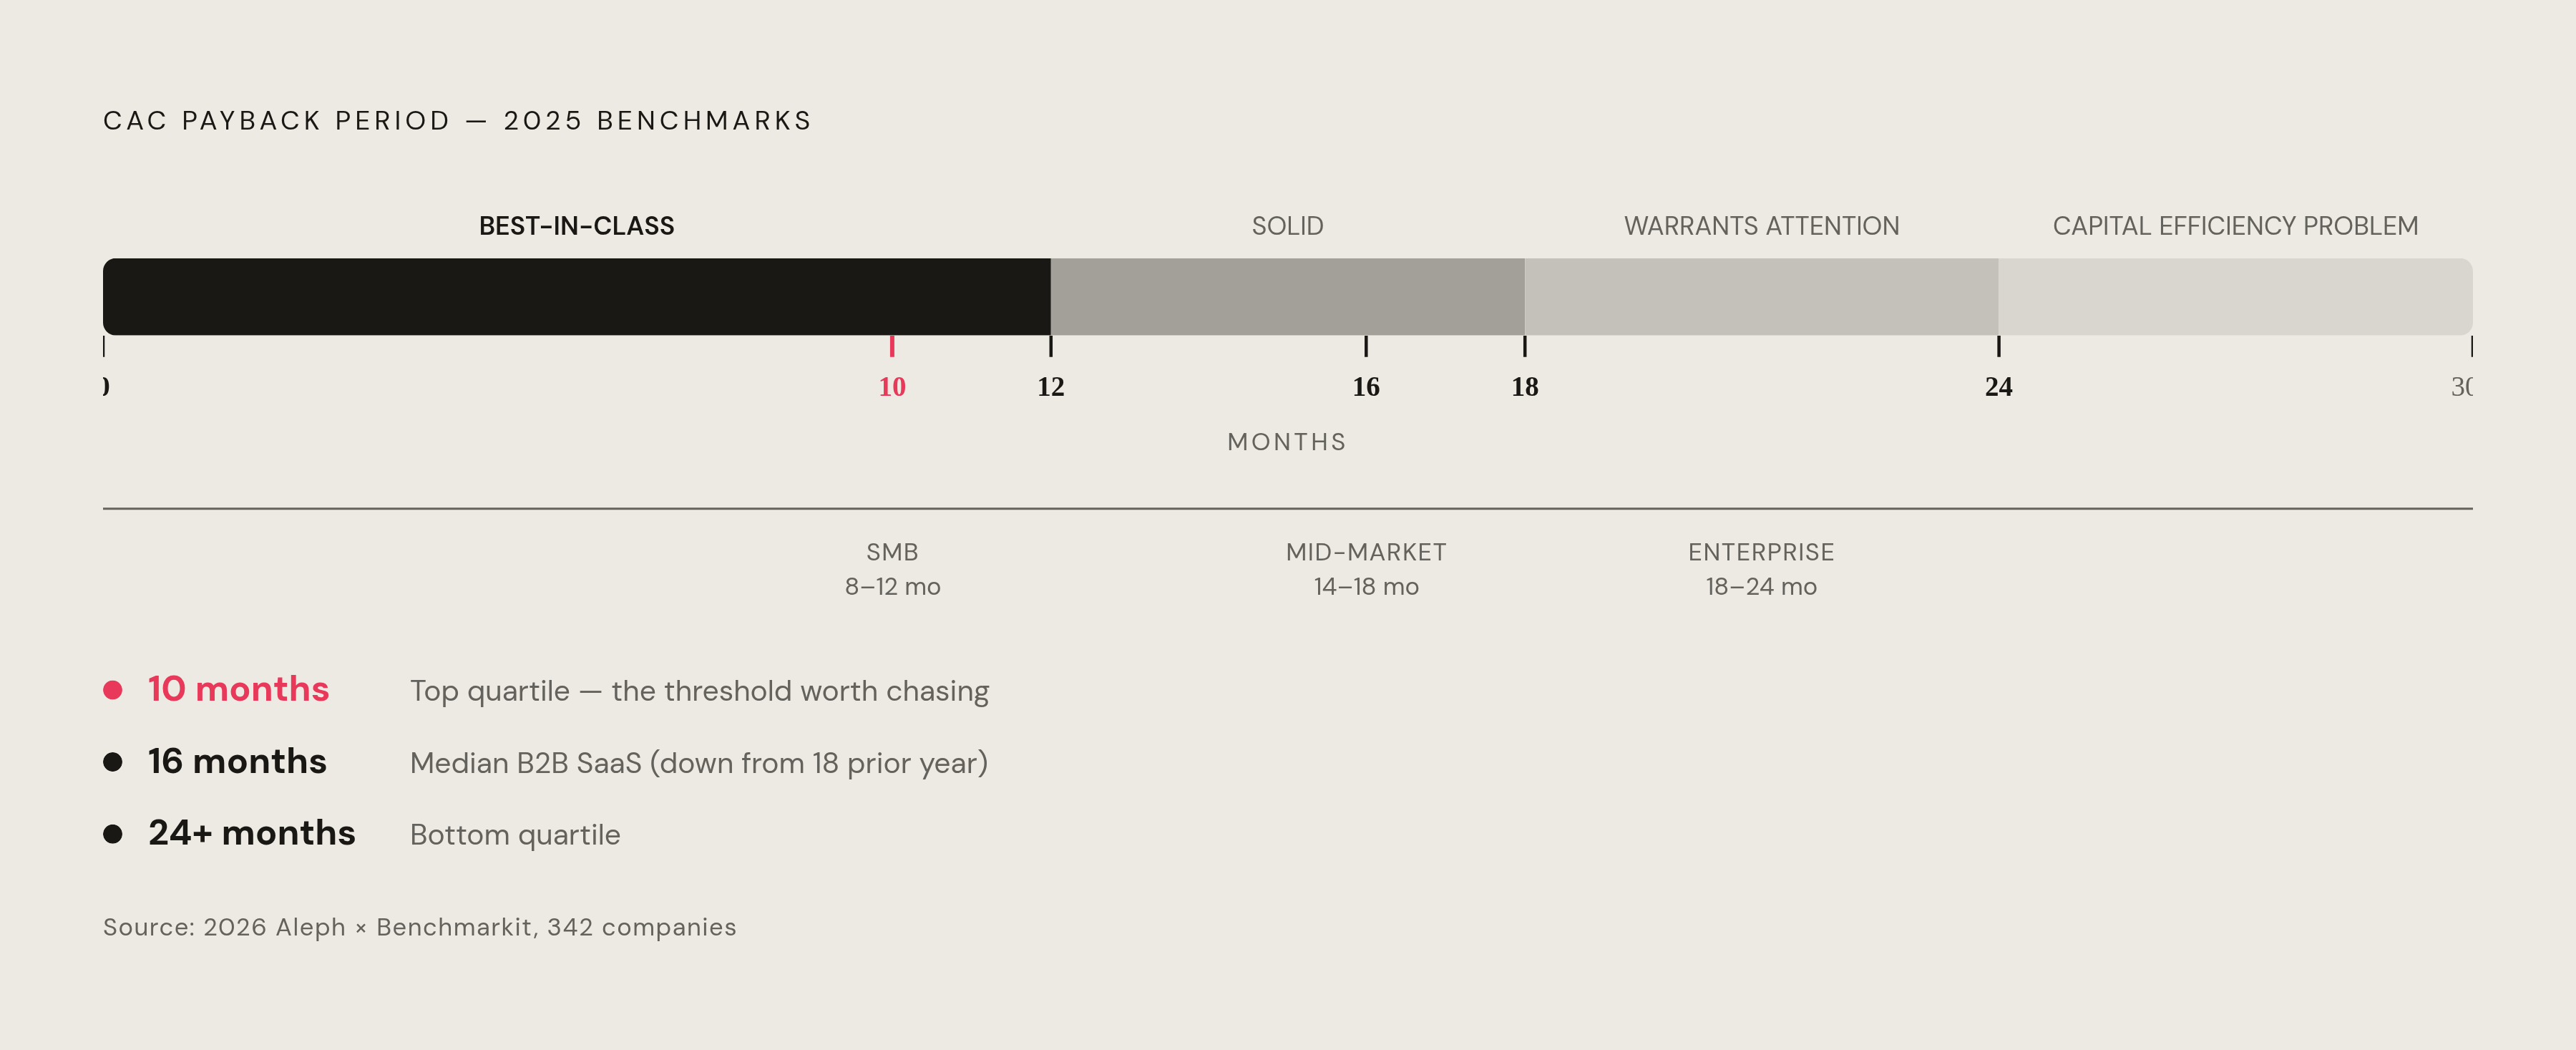
LTV:CAC tells you whether the economics work in theory. CAC payback period tells you how long you're actually waiting for the money to come back.
CAC Payback Period (months) = CAC ÷ (ARPA × Gross Margin %)
A shorter payback frees working capital sooner. That capital goes back into the next acquisition cohort. For a startup without a comfortable cash cushion, this timing matters more than the LTV ratio does.
2025 benchmarks from the 2026 Aleph × Benchmarkit SaaS and AI Performance Benchmarks, across 342 companies: the median B2B SaaS payback period is 16 months, improved from 18 months the prior year. That 11% gain came from go-to-market (GTM) efficiency, not increased spend. Top quartile companies are at 10 months or fewer. Bottom quartile is at 24 months or more.
Segment-specific ranges from the Optifai Sales Ops Benchmark, 939 companies:
- SMB: 8 to 12 months
- Mid-market: 14 to 18 months
- Enterprise: 18 to 24 months
- Sub-$5K ACV products: 11-month median
- $50K to $100K enterprise deals: 22 months
Under 12 months is best-in-class. 12 to 18 months is solid. 18 to 24 months warrants real attention. Over 24 months is a capital efficiency problem that compounds quietly until it doesn't.
There's one meaningful exception worth naming. A longer payback period is more tolerable when net dollar retention, also reported as net revenue retention or NRR, is strong. If customers expand significantly over their lifetime, the LTV:CAC ratio can compensate for a slower payback curve. For one-time purchase businesses, that safety valve doesn't exist, and payback period becomes the metric that matters most.
The Five Calculation Mistakes That Silently Corrupt Your CAC Number
None of these are edge cases. Every one of them shows up regularly, and none of them feel like mistakes while they're happening. That's what makes them dangerous.
Excluding salary and overhead costs. The most common error and the most damaging one. It's responsible for the 40 to 60 percent undercount documented across startup datasets. The fix is straightforward in principle: allocate every team member's time proportionally. If someone splits their role between acquisition and account management, only the acquisition-facing percentage enters the numerator. Most teams skip this because it's uncomfortable to assign a dollar value to everyone's calendar. It's uncomfortable. Do it anyway.
Confusing CAC with cost per lead or cost per acquisition (CPA). Cost per lead captures only the top of the funnel. CAC has to absorb the full journey through conversion, including everything that happens between "interested" and "paying." A CPL of $500 can translate to a true CAC of $2,000 once sales cycles, nurture costs, and conversion losses are factored in. That's a 75% understatement, and it happens because the top-of-funnel number is easy to pull from a dashboard and the full number requires actual accounting. They are measuring different things entirely. Using one as a proxy for the other produces a number that's confidently wrong.
Misaligning time periods. Heavy spend in Q4 that converts customers in Q1 distorts both quarters if you don't account for the lag. The fix is a consistent lag model or rolling average, depending on how long your sales cycle runs. For businesses with short cycles, this matters less. For anyone selling into mid-market or enterprise, it matters a lot, and the distortion compounds as the team grows.
Mixing acquisition and retention costs. Customer success, onboarding, and upsell activity are not acquisition costs. Including them inflates CAC and muddles both metrics. Keep the lines clean. Acquisition costs acquire. Retention costs retain. They inform different decisions and should never share a bucket, even when lumping them together feels easier in the moment.
Relying on a single blended CAC across all channels. Blended CAC is fine for high-level reporting. It is not useful for making allocation decisions. A blended number can look perfectly healthy while one or two channels quietly destroy returns underneath it. Channel segmentation surfaces those problems before they become a cash flow issue. The work itself isn't glamorous: tagging your CRM, auditing your UTMs, building channel-specific cost views. It takes time. But it's the difference between a number that describes the past and one that actually tells you what to do next.