Best Analytics and Attribution Tools for Startups
Start with GA4 and product analytics, then add attribution and CDPs as your startup scales.

There are four categories of analytics a startup will eventually need. Not all at once. But knowing what each one does helps you avoid buying the wrong thing at the wrong time.
Web and marketing analytics. Who is showing up, where are they coming from, and what are they doing on your site? This is the surface layer. It answers top-of-funnel questions before you know much else.
Product analytics. What are users doing inside your product? Where do they drop off? What behaviors actually predict retention versus churn? This layer lives behind the login screen.
Marketing attribution. Which spend, across which channels, is generating revenue? This is the hardest category to get right and the most expensive to get wrong.
Customer data platforms (CDPs). This one is different from the other three. A CDP is not an analytics tool. It is the plumbing that connects your other tools together so the data flowing through them is consistent. Infrastructure, not insight.
Most early-stage startups only need two of these four to start. Almost always: web analytics and product analytics. That is the decision that matters most in year one. The sequencing mistake that kills analytics ROI is buying Amplitude and a CDP before you have a single clean event firing consistently. There is nothing to analyze and nothing to unify.
One broader signal before we get into the specifics: when Fivetran and dbt Labs merged in late 2025, it marked something real. The era of assembling your own modular data stack from 40 different vendors is ending. The market is moving toward fewer, more integrated tools. For startups without a data engineering team, that is genuinely good news.
The lines between categories are also blurring fast. Standalone attribution tools are getting absorbed into larger revenue platforms. Providers that used to do one thing cleanly are now doing four things with varying quality. Feature lists are becoming unreliable as purchase signals, which is exactly why this piece organizes everything by stage instead.
What GA4 Gives You for Free and Where It Stops Being Enough
GA4 is genuinely good. Free, unified web and app tracking in one property, predictive metrics, BigQuery export, native Google Ads integration. For a pre-PMF team that mostly needs to understand traffic patterns and basic funnel shape, that is a real toolkit and you should use it.
But GA4 has structural limits. These are design choices that eventually stop matching your questions, not bugs.
Here is where it starts to fall apart:
No native billing integration. GA4 cannot connect to Stripe or Chargebee. That means you cannot optimize campaigns against LTV, MRR, or churn. You end up optimizing against conversions, not revenue quality, which is a very different thing.
Data-driven attribution requires conversion volume to function. It needs enough data to model reliably. Early-stage campaigns often cannot meet that threshold.
Limited cost import coverage. As of late 2025, GA4's native cost import supports Meta, TikTok, Pinterest, Snapchat, and Reddit. Microsoft Ads and LinkedIn are absent from that list.
Client-side tracking leaks. Browser restrictions, ad blockers, and consent declines eat 20 to 40 percent of attribution data, and first-party data collection is the only structural response to that loss. Around 1.77 billion users globally run some form of ad blocking, with more than 40 percent of desktop users affected. That is not a rounding error — it is like trying to read a book with every third page torn out.
The practical read: GA4 is a solid starting layer for B2C and content-driven startups. B2B SaaS teams should treat it as a traffic and engagement signal, not a revenue attribution source, and that realization comes faster than most teams expect. The average customer touches more than six channels before converting. In B2B, that number rises above 14. GA4 alone will misattribute most of that journey. It was never designed for it.
Choosing a Product Analytics Tool: Mixpanel, Amplitude, and PostHog Compared by Team Type
These three tools track what users do inside your product. Not how they found you. That distinction matters more than most teams realize early on. Conflating product analytics with marketing analytics is a common and expensive mistake.
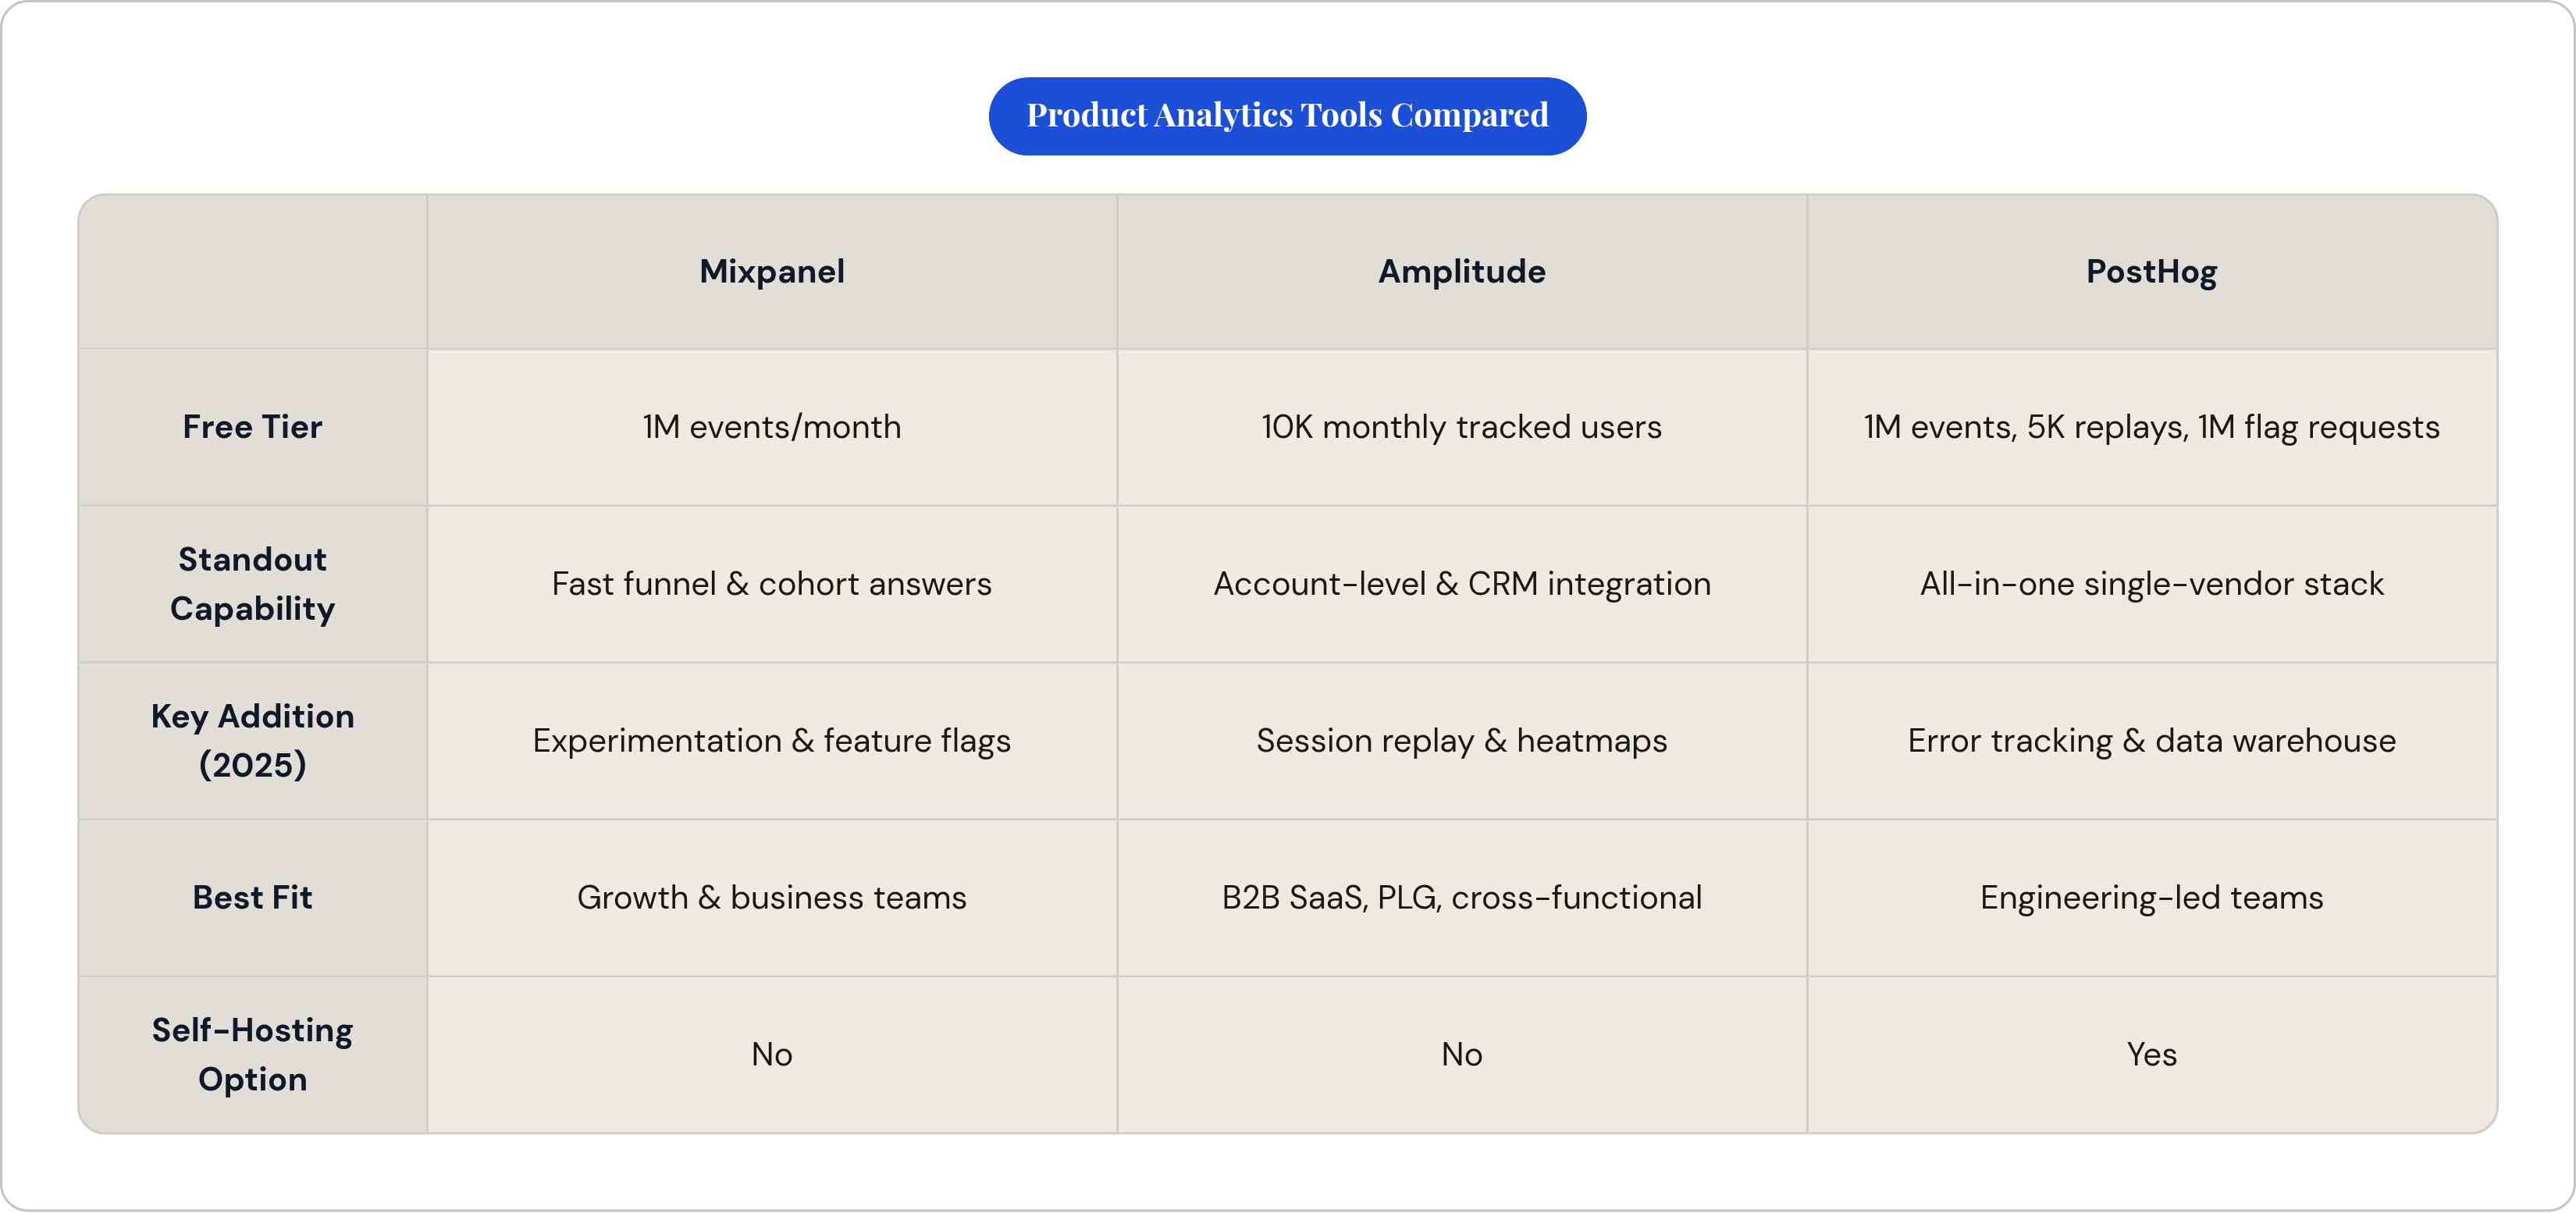
Mixpanel is event-based and, once instrumented, easy enough for non-engineers to actually run. Funnels, retention curves, cohort analysis. You can get real answers in a day if your events are clean. The free tier covers one million events per month, and their startup program (for companies under five years old and under $8M raised) offers up to a year free with up to a billion events. That is genuinely generous. In late 2025, Mixpanel added experimentation and feature flags, so it now overlaps more with Amplitude than it used to. Best fit: business teams, growth teams, and technical founders who need answers fast without heavy engineering support.
Amplitude added session replay, heatmaps, and a lower-cost entry tier in response to years of pricing complaints. The free tier runs at 10,000 monthly tracked users. Where it earns its place is account-level analytics, behavioral cohorts, and Salesforce integration. It was built for B2B SaaS teams that need product-led growth (PLG) reporting and cross-functional governance. Best fit: B2B SaaS teams that need multiple people pulling reports, account-level visibility, and a product analytics layer that connects to their CRM.
PostHog is the most unusual option in this set. It bundles product analytics, session replay, feature flags, A/B testing, surveys, error tracking, and a data warehouse into one platform, functioning as a single-vendor alternative to a modular analytics stack. The free tier is the most generous of the three: one million events, 5,000 session replays, and one million feature flag requests per month. The startup program adds $50,000 in credits. Self-hosting is available, which appeals to teams with data residency requirements, though it adds real operational burden. PostHog has grown primarily through engineering word-of-mouth rather than a traditional sales motion. That tells you something honest about who it is actually for.
One thing worth saying plainly: Amplitude and Mixpanel have spent the last two years copying each other's features. The practical differences are narrowing. At this point, team type and workflow are more reliable decision criteria than any feature comparison. Pick the one that matches how your team actually works, not the one with the longer changelog. The tool your growth team will actually open every morning beats the technically superior one that sits unused.
Why Last-Touch Attribution Keeps Misleading Teams That Have Outgrown GA4
Last-touch attribution became the default for a simple reason. It was easy to implement, easy to explain, and it produced clean metrics that fit neatly into a report. It matched the tools that were available, not how people actually make purchase decisions.
The structural problem: crediting only the final touchpoint before conversion makes every dollar invested in awareness, education, or mid-funnel channels look invisible. Per Gartner's 2025 UK Digital Marketing Survey, only 24 percent of B2B organizations currently use multi-touch attribution (MTA). The majority are making budget decisions off a model that ignores most of the customer journey — like a detective who only looks at the last suspect in the room and calls the case closed.
The cost is not abstract. A company spending $500K annually on marketing is misallocating somewhere between $150K and $250K based on last-touch data. Research from Forrester and McKinsey points to an 18 percent average improvement in marketing ROI and a 15 percent reduction in customer acquisition cost (CAC) for organizations that implement multi-touch attribution. Those are not marginal gains.
There is a catch, though, and it matters. Even if you upgrade to multi-touch attribution, expect only 30 to 60 percent attribution coverage by 2026. Browser restrictions, privacy regulations, and consent declines create a structural ceiling that no single model breaks through. Multi-touch attribution is better than last-touch, but it is incomplete. Which is exactly why the next section exists.
Marketing Attribution Tools for Startups, Matched to Ad Spend Level
The organizing principle here is simple: attribution tool complexity should scale with ad spend, not ambition. A $20K per month spender using an enterprise-tier attribution platform is paying for infrastructure they cannot validate yet.
Under $1M annually: Triple Whale or Northbeam.
Triple Whale started as a Shopify analytics dashboard and has grown into what it now calls an agent-powered intelligence platform, used by more than 45,000 ecommerce and retail brands. It bundles multi-touch attribution, media mix modeling, CTV attribution, and creative analytics. The core mechanism is its Triple Pixel, which captures first-party data directly from the merchant's site. That design was built specifically for a post-cookie world and cookieless tracking environments. During BFCM 2025, brands on the platform generated $2.88 billion in revenue, nearly 20 percent of all Shopify merchant sales that period.
One feature worth calling out: Triple Whale lets teams compare attribution models side by side. A channel that looks strong under last-touch can look very different under a data-driven model. Seeing both at once prevents overinvestment in channels that are gaming a single model.
Northbeam at this tier is strong for paid media practitioners who need campaign and creative-level data for daily optimization. One practical note: pricing has moved from around $300 per month to closer to $1,500 per month. That jump changes its startup fit considerably, so verify current pricing before assuming it lands in your budget.
$1M to $3M annually: Northbeam or Rockerbox, with incrementality testing added.
Rockerbox has a specific differentiator that makes it relevant in this range: it connects TV spots, podcast ads, direct mail, and offline events to online conversions. It is the only platform in this set built for omnichannel measurement rather than digital-only. DoubleVerify acquired Rockerbox in early 2025 for $85M, which adds verification capabilities but also introduces some product roadmap uncertainty worth tracking. Entry pricing starts in the $150 to $300 per month range for lower tiers.
At this spend level, you should also be layering in incrementality testing. Attribution models tell you what looks correlated. Incrementality experiments tell you what is actually causal. Those are different questions, and mixing up the answers is how you end up confidently scaling a channel that was never doing what you thought it was.
$3M+ annually: Add Measured or Recast.
At this spend level, multi-touch attribution alone is not enough. Marketing Mix Modeling (MMM) and incrementality testing become necessary validation layers. Measured and Recast are built specifically for that purpose. This is where blended attribution becomes the only honest approach, which the next section covers.
B2B and subscription SaaS: Different tool logic entirely.
Wicked Reports was built for attribution that tracks from first touch all the way through to customer lifetime value. In subscription businesses, the initial conversion is not the endpoint. It tracks which channels acquire customers with the highest retention rates, not just the most sign-ups. That is a fundamentally different optimization target.
HockeyStack was built specifically for longer buying cycles and account-level attribution, where session-based models fundamentally fail. If your sales cycle is three to six months and involves multiple stakeholders, session-based attribution is not a minor inaccuracy. It is the wrong model entirely.
Why MTA Alone Is Not Enough and What "Blended Attribution" Means in Practice
Multi-touch attribution and marketing mix modeling answer different questions. Knowing which is which prevents you from using the wrong tool to make the wrong decision.
MTA tracks individual user paths across touchpoints. It is user-level, granular, and channel-specific. It tells you which specific touchpoints a specific user hit before converting. The limitation: it is constrained by privacy restrictions, and coverage will fall somewhere between 30 and 60 percent in 2026 even with the best platforms available. That is a structural ceiling, not a vendor problem.
MMM is statistical and aggregate. It uses historical spend and sales data to model which channels are driving results. No user-level data required. That makes it privacy-safe by design. The trade-off: it is slower to produce results and less granular at the campaign level. You are not going to use it to decide whether to pause a specific ad set tomorrow.
Blended attribution in practice means using both. MMM for macro budget allocation across channels. MTA for campaign-level daily optimization. Incrementality experiments run quarterly to validate that the channels your models are crediting are actually driving real conversions, rather than just claiming credit for buyers who would have converted anyway.
One practical note on sequencing: most startups should hold off on this blended approach until they have enough spend volume and data history to make the models meaningful. Running MMM on three months of thin data produces noise, not insight. Triple Whale's side-by-side model comparison feature is one example of a tool designed to surface the tension between models operationally, rather than requiring a dedicated analytics team to sort it out manually.
When a Startup Needs a CDP and When It Doesn't
A CDP collects, unifies, and routes customer data to your downstream tools. It is the plumbing. Not the analytics itself. The CDP makes the other tools reliable by ensuring they are all working from the same source of truth.
The common mistake: buying a CDP before you have consistent event data flowing from anywhere. There is nothing for it to unify. It just sits there, costing money, waiting for data that has not arrived yet.
The signal that you actually need one: data is living in multiple tools (your product analytics, CRM, email platform, billing system), and your engineers are spending meaningful time on one-off integrations instead of building product. That is the moment a CDP starts paying for itself.
Twilio Segment is the default choice for developer-first teams. Founded in 2011, acquired by Twilio in 2020 for $3.2 billion. It has over 700 pre-built connectors, one of the largest integration catalogs in the market. The developer-first design includes schema enforcement and data quality controls that matter when your data pipelines are feeding attribution models or product analytics. Pricing grows significantly as monthly tracked users increase, which becomes a real consideration if you instrument broadly, so it is not cheap at scale.
RudderStack is the cost-conscious alternative. Open-source core, self-hostable, lower cost at equivalent data volume compared to Segment. The trade-off: it requires more engineering setup and ongoing maintenance. The cost saving is real, but it comes with operational overhead. Best fit for engineering-led teams with data residency requirements or teams that have already hit Segment's pricing ceiling.
Plain answer: most pre-Series A startups do not need a CDP. A well-instrumented product analytics tool and a clean CRM integration cover most of what they actually use day to day. If you are debating whether you need one and you have not yet hit the "engineers wiring integrations" problem, you do not need one yet.
A Stage-Based Framework for Deciding What to Implement and in What Order
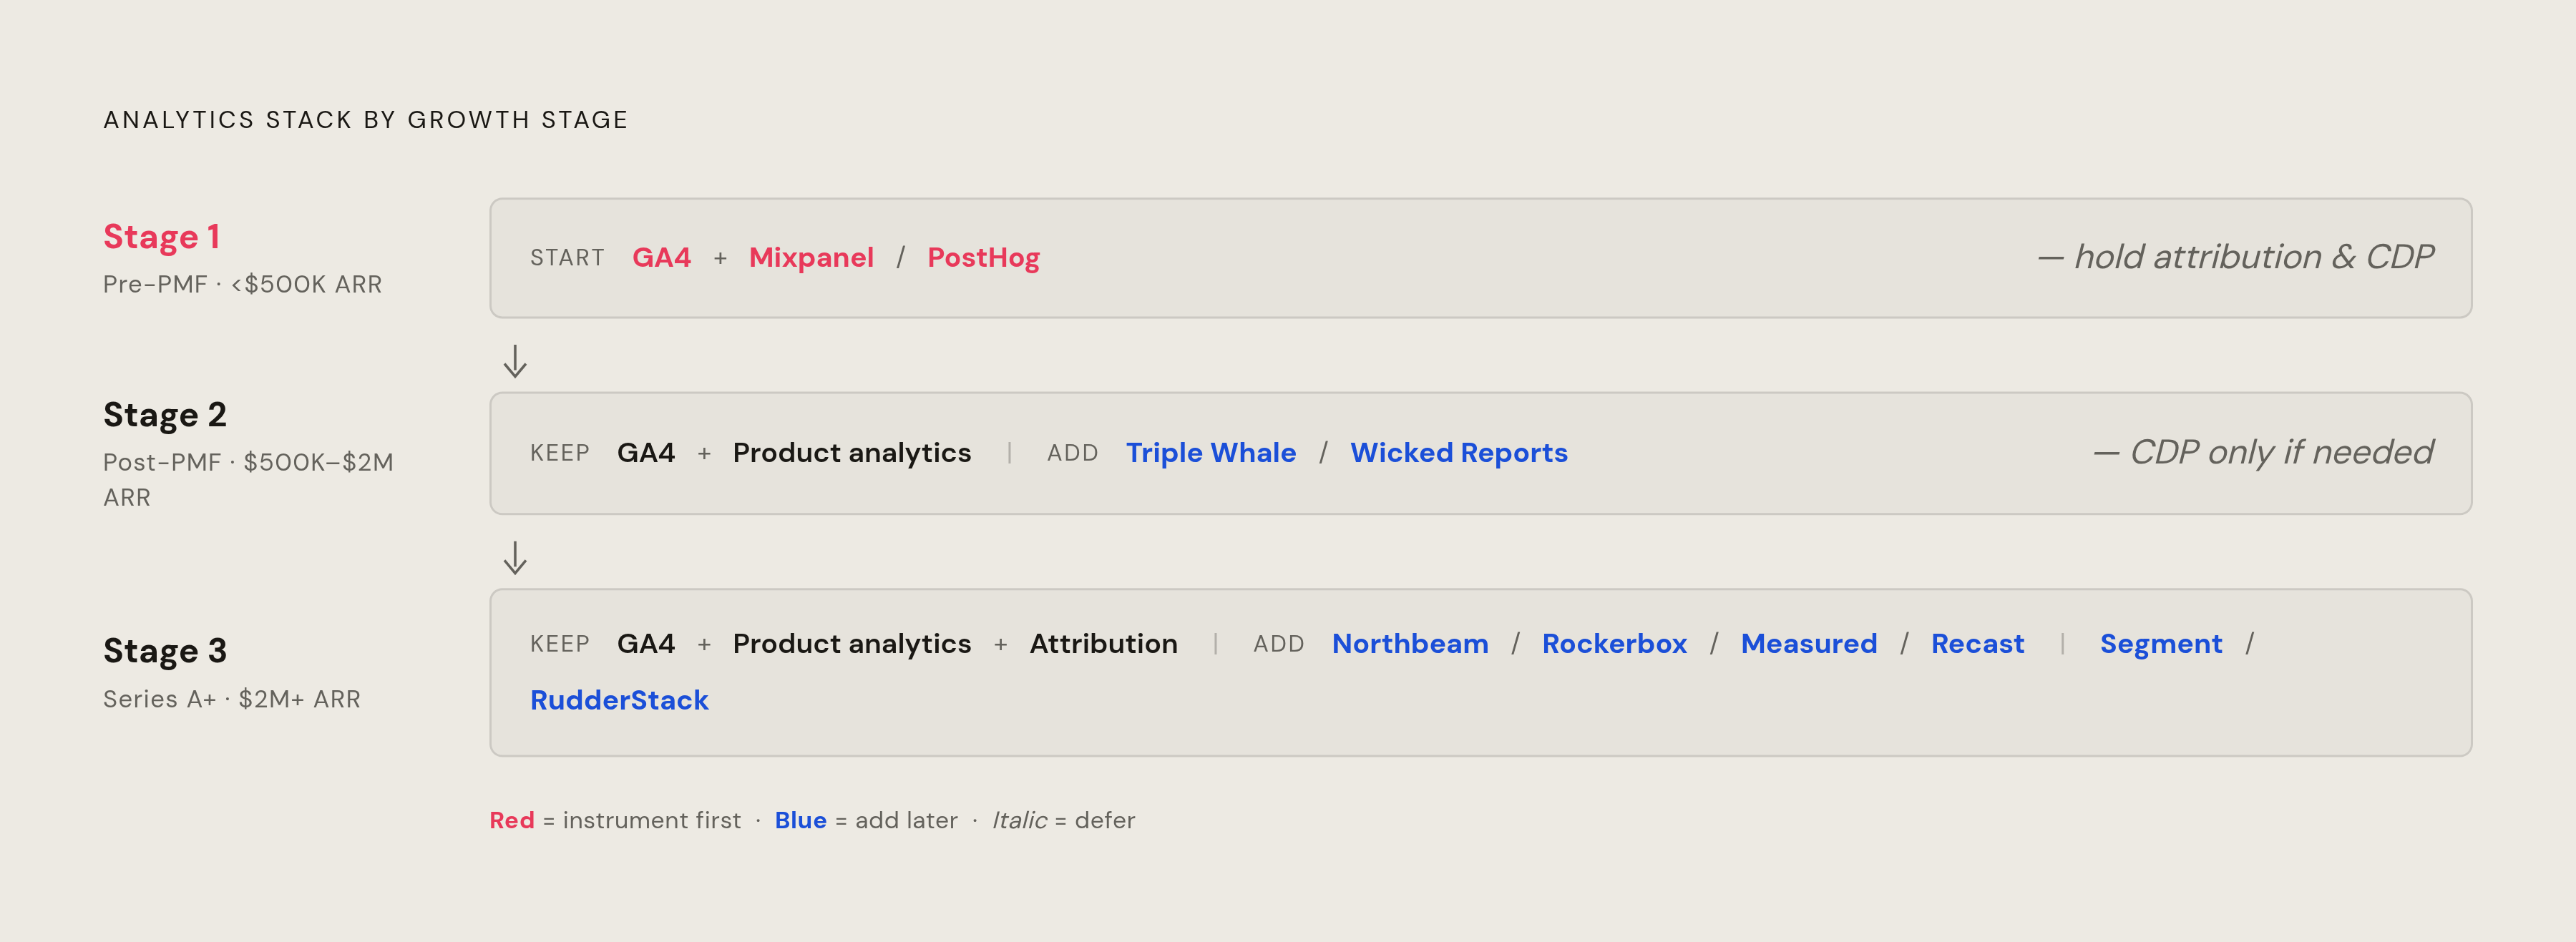
This is the part that makes everything above concrete. The order matters as much as the tools.
Pre-PMF (under $500K ARR, limited ad spend). Start with GA4 for web analytics. Free, fast to set up, enough to understand traffic patterns and basic funnel shape. Add one product analytics tool. Mixpanel is the easiest starting point for most teams. PostHog if your team is engineering-led and wants everything in one place.
Hold off on attribution software for now. A CDP can wait too. You don't have the conversion volume to make attribution models meaningful, and you don't have enough tools running to need a CDP to connect them. The goal at this stage is instrumentation. Get clean events firing. Understand what your users are actually doing. Everything else builds on that foundation, and if the foundation is dirty, every tool you add on top will give you bad answers. I have watched teams spend six months setting up a beautiful attribution dashboard on top of broken event tracking and wonder why nothing made sense. The dashboard was not the problem.
Post-PMF, Pre-Series A (roughly $500K to $2M ARR, meaningful ad spend starting). This is when attribution starts to matter in a real way. Keep GA4 as your web layer. Keep or upgrade your product analytics tool based on what your team has outgrown. Add an attribution tool matched to your spend level. Under $1M annually, Triple Whale (ecommerce) or Wicked Reports (B2B subscription) are the logical starting points.
Start asking whether your engineers are spending time on data integrations. If yes, explore Segment or RudderStack. If no, wait.
Series A and beyond ($2M+ ARR, multiple channels, growing team). Now the stack grows intentionally. Add incrementality testing to your attribution layer. Consider Northbeam or Rockerbox if you are in the $1M to $3M annual spend range. Evaluate whether your product analytics tool still matches your team's reporting needs. B2B SaaS teams often outgrow Mixpanel's account-level capabilities and move toward Amplitude at this stage, and that is a normal and fine thing to do.
If engineering is still wiring one-off integrations, a CDP is now worth it. Segment for teams that want a managed solution with minimal setup. RudderStack for teams that want control and have the engineering capacity to maintain it. At $3M or more in annual ad spend, add Measured or Recast for MMM alongside your MTA platform. Last-touch is not just limiting at this level. It is actively steering you wrong.
The same principle runs through all three stages: buy the tool that matches the question you are actually trying to answer today, with the data you actually have, at the spend level you are actually running. Not the tool that sounds impressive, not the one your better-funded competitor is using. The one that fits right now. You can always upgrade later. The months you spend instrumenting a platform you were not ready for, though. Those you do not get back.